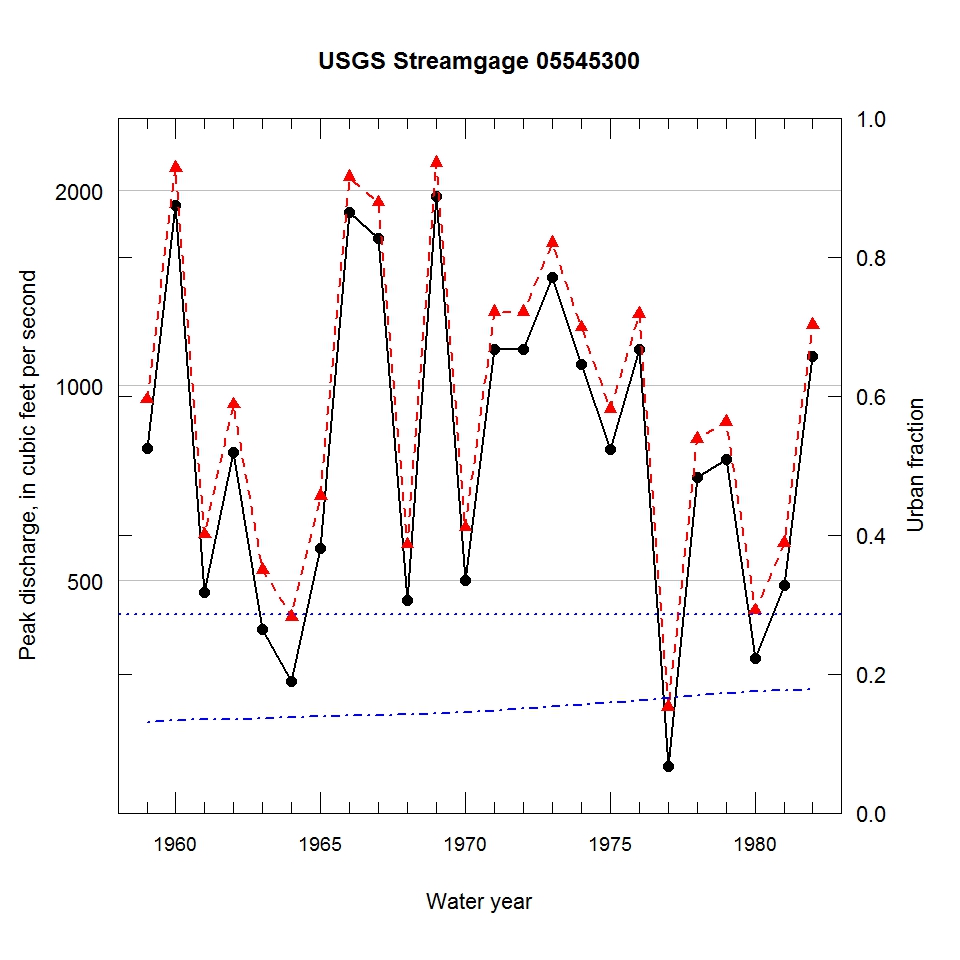
Observed and urbanization-adjusted annual maximum peak discharge and associated urban fraction and precipitation values at USGS streamgage:
05545300 WHITE RIVER NEAR BURLINGTON, WI


| Water year | Segment | Discharge code | Cumulative reservoir storage (acre-feet) | Urban fraction | Precipitation (inches) | Observed peak discharge (ft3/s) | Adjusted peak discharge (ft3/s) | Exceedance probability |
| 1959 | 1 | -- | 40000 | 0.130 | 0.001 | 800 | 952 | 0.502 |
| 1960 | 1 | -- | 40000 | 0.133 | 1.070 | 1900 | 2170 | 0.061 |
| 1961 | 1 | -- | 40000 | 0.134 | 0.331 | 480 | 589 | 0.800 |
| 1962 | 1 | -- | 40000 | 0.135 | 0.001 | 790 | 936 | 0.516 |
| 1963 | 1 | -- | 40000 | 0.136 | 0.549 | 420 | 520 | 0.847 |
| 1964 | 1 | -- | 40000 | 0.138 | 0.104 | 350 | 440 | 0.896 |
| 1965 | 1 | -- | 40000 | 0.139 | 0.131 | 560 | 676 | 0.737 |
| 1966 | 1 | -- | 40000 | 0.140 | 1.584 | 1850 | 2100 | 0.067 |
| 1967 | 1 | -- | 40000 | 0.141 | 1.705 | 1690 | 1920 | 0.087 |
| 1968 | 1 | -- | 40000 | 0.142 | 2.331 | 467 | 569 | 0.815 |
| 1969 | 1 | -- | 40053 | 0.143 | 2.166 | 1960 | 2210 | 0.057 |
| 1970 | 1 | -- | 40053 | 0.145 | 1.261 | 500 | 604 | 0.789 |
| 1971 | 1 | -- | 40053 | 0.148 | 0.712 | 1140 | 1300 | 0.270 |
| 1972 | 1 | -- | 40053 | 0.151 | 0.842 | 1140 | 1300 | 0.272 |
| 1973 | 1 | -- | 40053 | 0.154 | 1.876 | 1470 | 1660 | 0.143 |
| 1974 | 1 | -- | 40113 | 0.157 | 0.598 | 1080 | 1230 | 0.311 |
| 1975 | 1 | -- | 40113 | 0.160 | 0.009 | 798 | 920 | 0.529 |
| 1976 | 1 | -- | 40113 | 0.163 | 0.838 | 1140 | 1290 | 0.279 |
| 1977 | 1 | -- | 40113 | 0.166 | 0.880 | 258 | 319 | 0.948 |
| 1978 | 1 | -- | 40113 | 0.169 | 2.480 | 722 | 828 | 0.612 |
| 1979 | 1 | -- | 40113 | 0.172 | 0.226 | 771 | 879 | 0.567 |
| 1980 | 1 | -- | 40113 | 0.175 | 0.198 | 380 | 450 | 0.891 |
| 1981 | 1 | -- | 40113 | 0.176 | 0.981 | 492 | 572 | 0.813 |
| 1982 | 1 | -- | 40113 | 0.177 | 3.071 | 1110 | 1240 | 0.306 |

